Debug Scripts
Debug With CKB-Debugger
Debugging Scripts on the Nervos CKB can be challenging without the right tools. We recommend using the CKB-Debugger, a powerful standalone command-line tool designed for off-chain Script development. With CKB-Debugger, you can efficiently identify and resolve issues in your Scripts, ensuring smooth execution and optimal performance.
Install
Install CKB-Debugger using cargo. We recommend using ≥v0.113.0.
cargo install --git https://github.com/nervosnetwork/ckb-standalone-debugger ckb-debugger
On MacOS, the protoc binary must be available to compile ckb-vm-pprof-converter. This can be installed via Homebrew:
brew install protobuf
Usage
ckb-debugger 0.113.0

USAGE:
    ckb-debugger [FLAGS] [OPTIONS] --mode <mode> --tx-file <tx-file> [args]...

FLAGS:
    -h, --help       Prints help information
        --prompt     Set to true to prompt for stdin input before executing
        --step       Set to true to enable step mode, where we print PC address for each instruction
    -V, --version    Prints version information

OPTIONS:
        --bin <bin>                                File used to replace the binary denoted in the script
    -i, --cell-index <cell-index>                  Index of cell to run
    -t, --cell-type <cell-type>                    Type of cell to run [possible values: input, output]
        --decode <decode>                          Decode RISC-V instruction
        --dump-file <dump-file>                    Dump file name
        --gdb-listen <gdb-listen>                  Address to listen for GDB remote debugging server
        --gdb-specify-depth <gdb-specify-depth>    Specifies the depth of the exec/spawn stack [default: 0]
        --max-cycles <max-cycles>                  Max cycles [default: 70000000]
        --mode <mode>
            Execution mode of debugger [default: full]  [possible values: full, fast, gdb, probe, gdb_gdbstub]

        --pprof <pprof>                            Performance profiling, specify output file for further use
        --read-file <read-file>
            Read content from local file or stdin. Then feed the content to syscall in scripts

    -s, --script-group-type <script-group-type>    Script group type [possible values: lock, type]
        --script-hash <script-hash>                Script hash
        --script-version <script-version>          Script version [default: 2]
        --skip-end <skip-end>                      End address to skip printing debug info
        --skip-start <skip-start>                  Start address to skip printing debug info
    -f, --tx-file <tx-file>                        Filename containing JSON formatted transaction dump

ARGS:
    <args>...
Examples
1. Execute Transactions Locally
To download an on-chain transaction from the network and execute it locally, use ckb-cli:
$ ckb-cli --url https://mainnet.ckbapp.dev/rpc mock-tx dump --tx-hash 0x5f0a4162622daa0e50b2cf8f49bc6ece22d1458d96fc12a094d6f074d6adbb55 --output-file mock_tx.json
Then execute the Lock Script or Type Script in the transaction:
$ ckb-debugger --tx-file mock_tx.json --cell-index 0 --cell-type input --script-group-type lock

Run result: 0
Total cycles consumed: 1697297(1.6M)
Transfer cycles: 12680(12.4K), running cycles: 1684617(1.6M)
To replace the Script in the transaction with a new version of the lock, use the --bin option:
// always_failure.c
int main() {
    return 1;
}
$ ckb-debugger --tx-file mock_tx.json --cell-index 0 --cell-type input --script-group-type lock --bin always_failure

Run result: 1
Total cycles consumed: 1706(1.7K)
Transfer cycles: 764, running cycles: 942
2. Debug Failed Transactions
In most case, you want to debug failed transactions instead of successful ones to find out the reasons for the failures.
The following example demonstrates debugging transactions built with the Lumos SDK, which is now considered a legacy option. If you are using CCC or other JavaScript SDKs, the transaction building API will differ.
First, dump the transaction into a local file. Assume you are using the Lumos SDK to build the transaction,
you can convert the txSkeleton type into a JSON file:
> let txJson = rpc.paramsFormatter.toRawTransaction(lumos.helpers.createTransactionFromSkeleton(txSkeleton))
> fs.writeFileSync('failed-tx.json', JSON.stringify(txJson, null, 2))
Next, convert the failed-tx.json to a dump transaction with context info using ckb-transaction-dumper:
$ ckb-transaction-dumper -t failed-tx.json -o full-failed-tx.json -r <mainnet/testnet/devnet RPC url>
Then, debug the Script. Remember to replace the cell-type and cell-index with the actual values in the following command:
$ ckb-debugger --tx-file full-failed-tx.json --cell-index 0 --cell-type output --script-group-type type
3. Debug Script with GDB
You can debug Scripts using GDB with ckb-debugger. Assume the Script is in fib.c:
int fib(int n) {
    if (n == 0 || n == 1) {
        return n;
    } else {
        return fib(n-1) + fib(n-2);
    }
}

int main() {
    if (fib(5) != 5) {
        return 1;
    }
    return 0;
}
After compiling fib.c to RISC-V binary fib, we can debug this Script in GDB mode:
$ ckb-debugger --mode gdb --gdb-listen 127.0.0.1:9999 --bin fib
$ riscv64-unknown-elf-gdb fib

$ (gdb) target remote 127.0.0.1:9999
$ (gdb) b fib
$ (gdb) c
    Breakpoint 1, fib (n=5) at fib.c:2
At the Breakpoint 1, we see that fib (n=5) at fib.c:2.
4. Debug Script with GDB in VSCode
Script debugging can be done in an IDE using ckb-debugger, which supports a gdbserver mode enabled with --mode=gdb. VSCode allows debugging via debugger extensions. Below, we explain how to use NativeDebug and CodeLLDB for CKB Script debugging.
For testing, refer to this project.
This guide uses Rust for demonstration. Similar principles apply to other languages as well.
Preparation
ckb-debuggersupports older versions of GDB. For LLDB, version 18 or higher is required (older versions lack robust RISC-V support).- For CodeLLDB, ensure the version is at least
v1.11. - For LLDB, use
ckb-debuggerversion0.118or above.
Compilation may involve some LLVM commands. Just ensure the LLVM version is not too old.
Compilation
If your project was created using ckb-script-templates, the following steps are likely already done. You can skip this section.
Due to CKB's memory constraints, by default, Scripts are compiled in Release mode without debug information. To enable debugging, update your Cargo.toml file with these settings for the release build:
[profile.release]
overflow-checks = true
strip = false
codegen-units = 1
debug = true
After compilation, use the following commands to prepare the Scripts for deployment and debugging:
cp <script_file> <script_file>.debug
llvm-objcopy --strip-debug --strip-all <script_file>
This produces two files:
<script_file>: The actual Script for testing and release.<script_file>.debug: A debug version with symbols. It is for debugging only due to the large size impossible to be executed as a Script.
VSCode Configuration
VSCode tasks are configured in tasks.json. Here you have two tasks: one to start ckb-debugger, the other to stop it.
{
    "label": "StartDbg-Rust",
    "isBackground": true,
    "type": "process",
    "command": "ckb-debugger",
    "args": [
        "--bin=rust/build/release/ckb-c1.debug",
        "--mode=gdb",
        "--gdb-listen=127.0.0.1:8000"
    ],
    "options": {
        "cwd": "${workspaceRoot}"
    },
},
{
    "label": "StopCkbDebugger",
    "type": "shell",
    "command": "killall ckb-debugger || true"
}
Explanation of the fields:
label: Customizable task nameStartDbg-Rust: Background-enabled task (isBackgroundset to true)--bin: Path to the Script file—gdb-listen: Listening address and port (e.g.,8000in this example, but it can be different).StopCkbDebugger: Stops theckb-debuggerafter a debug session. This is needed becauseckb-debuggerdoesn’t exit automatically after debugging, but waits for the next execution instead.
If multiple Scripts are debugged simultaneously, stopping one session may terminate others.
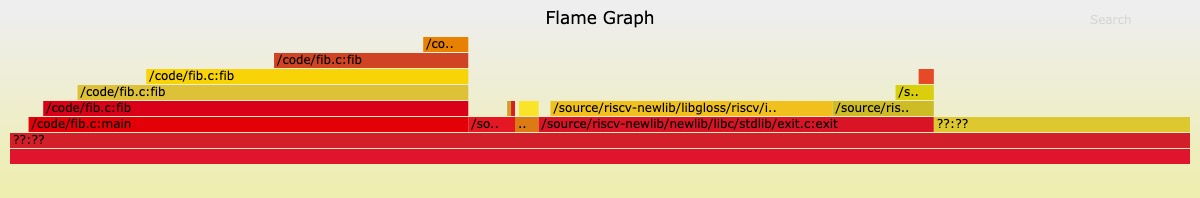
5. Profiling Data with Flamegraph Visualization Tool
Use ckb-debugger to profile data for flamegraph visualization:
$ ckb-debugger --bin fib --pprof fib.pprof
Install inferno to conver the profile data:
$ cargo install inferno
Then, pass the file created by ckb-debugger into inferno-flamegraph:
$ cat fib.pprof | inferno-flamegraph > fib.svg
Open the resulting SVG file to view the flamegraph:
Debug With Native Simulator
CKB Scripts follow the RISC-V specification and include APIs related to VM syscalls, making them incompatible to execute on common devices. Previously, many projects addressed this limitation by isolating the code unrelated to VM syscalls into separate libraries for development and testing. Some even implemented a rudimentary version of VM syscalls.
Native Simulator addresses this issue, allowing for compilation and debugging on the native platform, as well as contract-related APIs simulation. For the code unrelated to VM syscalls and thus not executable on RISC-V, it can be compiled into a native executable for the host platform and debugged, while the VM syscalls part is managed by the ckb-x64-simulator, which simulates the required APIs. With both parts are covered, you can proceed with project management and testing. These functionalities have been integrated into ckb-script-templates and ckb-testtool.
Below, we explain how to incorporate the Native Simulator into existing projects via ckb-script-templates or manually.
Preparation
- The
ckb-stdversion must be at least 0.16.3 (While the support was introduced since v0.16.1, but the features were not fully developed.). - Testing with
ckb-testtoolis recommended to save effort. For new projects, consider usingckb-script-templatesfor project management. For project already under development, evaluate the situation and decide on a case-by-case basis.
Create with ckb-script-templates
For projects created with the latest version of ckb-script-templates, initialize Native Simulator with the following command:
make generate-native-simulator CRATE=<Existing Script>
where CRATE must be an existing Script.
Once created, run make build to compile. If custom code causes errors, use #[cfg(feature = "native-simulator")] to handle them.
Create Manually
If ckb-script-templates is unavailable, manually integrate the Native Simulator as follows:
Step 1. Set Up the Project
a. Add a lib.rs file in the Scrip's src directory with the following content:
#![cfg_attr(not(feature = "native-simulator"), no_std)]
#![allow(special_module_name)]
#![allow(unused_attributes)]
#[cfg(feature = "native-simulator")]
mod main;
#[cfg(feature = "native-simulator")]
pub use main::program_entry;
b. Add a native-simulator feature in the Cargo.toml:
native-simulator = ["ckb-std/native-simulator"]
c. Update main.rs to conditionally enable no_std, no_main, ckb_std::entry!, (program_entry), and ckb_std::default_alloc!() for native-simulator:
#![cfg_attr(not(any(feature = "native-simulator", test)), no_std)]
#![cfg_attr(not(test), no_main)]

#[cfg(any(feature = "native-simulator", test))]
extern crate alloc;

#[cfg(not(any(feature = "native-simulator", test)))]
ckb_std::entry!(program_entry);
#[cfg(not(any(feature = "native-simulator", test)))]
ckb_std::default_alloc!();

pub fn program_entry() -> i8 {
    ...
    0
}
Step 2. Create and Configure a Library
Create a Rust lib <contract_name>-sim under ./native-simulator/. There is no naming convention required here, it's just a recommended format. Add this lib to Cargo.toml.
a. Include ckb-std and the Script in Step 1 as dependencies in Cargo.toml, with the native-simulator feature enabled, and ensure the lib type is cdylib:
[dependencies]
contract = { path = "../../contracts/contract", features = ["native-simulator"] }
ckb-std = { version = "0.16.3", features = ["native-simulator"] }
[lib]
crate-type = ["cdylib"]
b. Add the following code into lib.rs:
ckb_std::entry_simulator!(<contrace_name>::program_entry);
Step 3. Compile For Native Platform
Compile the code for the native platform. Address compatibility issues using #[cfg(not(any(feature = "native-simulator", test)))].
Step 4. Debug and Develop
Once the project is setup, use ckb-testtool (version 0.13.1 or higher) for testing. Refer to this example.
The newly added Context::add_contract_dir() function allows you to set up the Script and the Native Simulator directory.
To facilitate usage, add a native-simulator feature into the tests:
native-simulator = [ "ckb-testtool/native-simulator" ]
Step 5. Compile Script and Simulator Before Use
When the native-simulator feature is enabled, the Script will use the Native Simulator. At this point, you can use IDE debugging tools to set breakpoints within the Script for debugging.
How It Works
For the Script, ckb-std uses ckb-x64-simulator to simulate on-chain data. This simulator receives the file paths of the transaction data required via two environment variables: CKB_TX_FILE and CKB_RUNNING_SETUP, where:
CKB_TX_FILEcontains transaction informationCKB_RUNNING_SETUPcontains miscellaneous data related to the transaction
One key item in CKB_RUNNING_SETUP is native_binaries. It maps the Script to its corresponding Native Simulator, primarily used in exec and Spawn.
In the native-simulator, ckb-std provides a macro: entry_simulator (similar to entry). This macro exports two C functions: __ckb_std_main and __set_script_info, as shown below:
unsafe extern "C" fn __ckb_std_main(
            argc: core::ffi::c_int,
            // Arg is the same as *const c_char ABI wise.
            argv: *const $crate::env::Arg,
        ) -> i8 { ... }
unsafe extern "C" fn __set_script_info(
            ptr: *mut core::ffi::c_void,
            tx_ctx_id: u64,
            proc_ctx_id: u64,
        ) { ... }
where:
__ckb_std_main: the entry function. When executed, it dynamically loads the lib and runs this function. The transaction information of the Script is passed through the two above-mentioned environment variables.__set_script_info: responsible for passing the global state necessary forexecandspawn.
- The separate crate
$crate::env::Argis used to prevent project complexity, as combining these two functions would complicate maintenance. - For developers wishing to use this feature, we recommend to use
ckb-testtoolfor development and testing to simplify work. - Script and Native Simulator are bound one-to-one. If
ckb-testtoolcannot locate the corresponding Native Simulator, it will automatically execute the Script's results. - Native Simulator is exclusively for debugging and cannot execute in CKB-VM. Be mindful when deploying Script on-chain.
- Native Simulator simulates Script execution, but cannot guarantee identical result to a real environment. Therefore, it should be used only for development.
Which Method to Choose
These two debugging methods have their pros and cons. We recommend choosing based on the stage of your project (new or in maintenance) and your priority (compatibility or efficiency).
| Feature | CKB-debugger + VSCode | Native Simulator |
|---|---|---|
| Pros | -High compatibility, ready for earlier projects. - No discrepancies after deployment because CKB-VM and on-chain data retrieval are shared with CKB. | - High execution efficiency. - Advanced debugging tools (e.g., memory inspection). |
| Cons | - Subtle differences from actual script execution. - Requires a recent version ckb-std and some additional code. | |
| Ideal for | Projects in maintenance mode where minimal disruption is desired. | New projects or projects undergoing major modification that require extensive debugging. |
| Tips | - Use with ckb-script-templates and ckb-testtool. - Avoid enabling Native Simulator in CI (Continuous Integration) testing. |